
DNA Testing Guides / Paternity Results
How to Read Paternity Test Results: 0%, 99.9%, CPI & DNA Report Explained
Your paternity DNA test report contains more than a simple yes-or-no answer. Learn what “excluded” and “not excluded” mean, how the Combined Paternity Index (CPI) and probability of paternity are interpreted, and how to read the genetic marker table—using annotated laboratory report examples.
Start here
What do paternity test results actually mean?
A postnatal paternity test compares inherited DNA markers from a child with those from the alleged father (and sometimes the mother). A laboratory evaluates whether the patterns support the proposed father–child relationship or exclude it. Samples are commonly collected with a painless buccal (cheek) swab.
The numeric results should never be assessed in isolation from the laboratory's final interpretation, especially if a DNA mutation, an unusual family relationship or additional testing is relevant.
Illustrated walk-through
The four main parts of a paternity DNA report
The DDC-style sample report shown below is divided into four areas. The visual format can differ by laboratory, report date and test type, but these concepts are widely used in relationship DNA testing.
- 1Genetic system tableDNA loci, allele sizes and individual Paternity Index values.
- 2Combined Paternity IndexCombined statistical strength of the genetic evidence.
- 3Probability of paternityStatistical probability under the assumptions used.
- 4Test conclusionThe laboratory's written inclusion or exclusion interpretation.
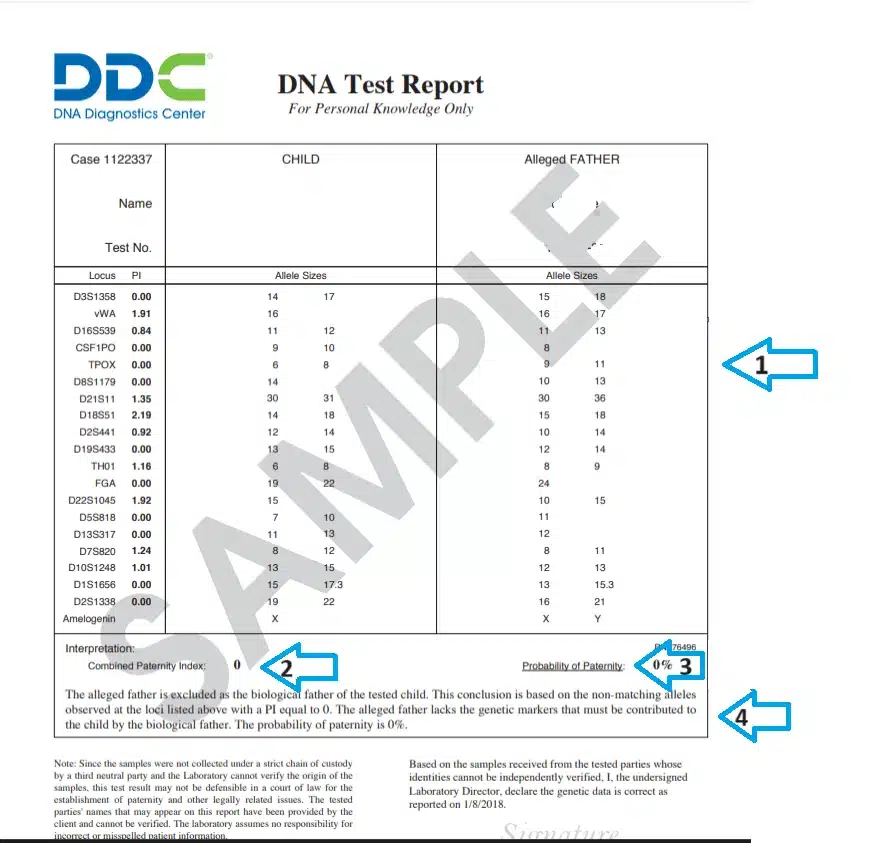
The supplied illustrations show examples of DDC-branded report layouts, including historical sample formats. An actual report may include different markers, values, headings or participant identifiers.
Part 1 / Genetic system
How the DNA marker table and allele matching work
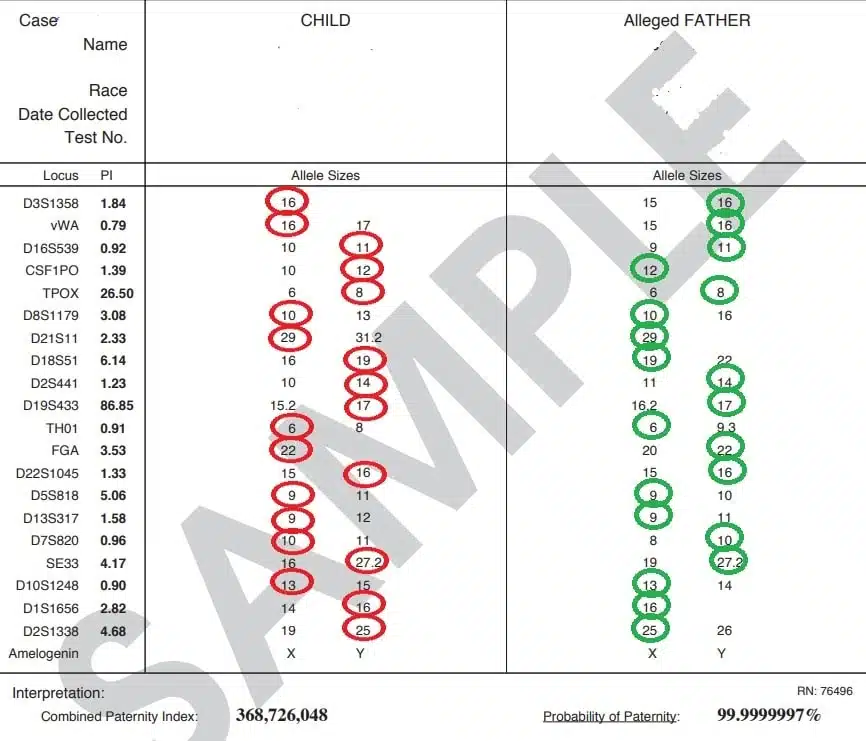
Each line of the genetic system table represents a DNA location (a locus, plural loci). The numbers printed for each participant show the detected allele sizes at that marker. For autosomal markers, a child ordinarily inherits one allele from each biological parent.
For example, if a child's results at a locus are 16 and 17, and the alleged father's results are 15 and 16, the shared 16 allele is compatible with inheritance from that man at that locus. One shared marker alone cannot prove paternity; the laboratory evaluates many independent markers and the overall statistical pattern.
Example: matching allele values
The colored circles identify allele sizes compatible with inheritance across the child's and alleged father's profiles.
Example: multiple mismatches
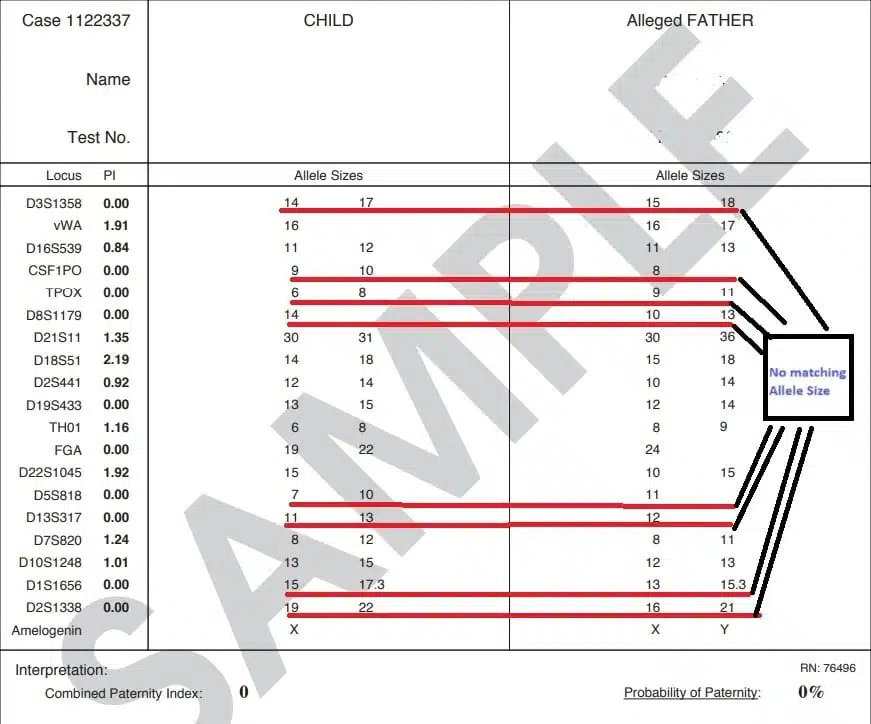
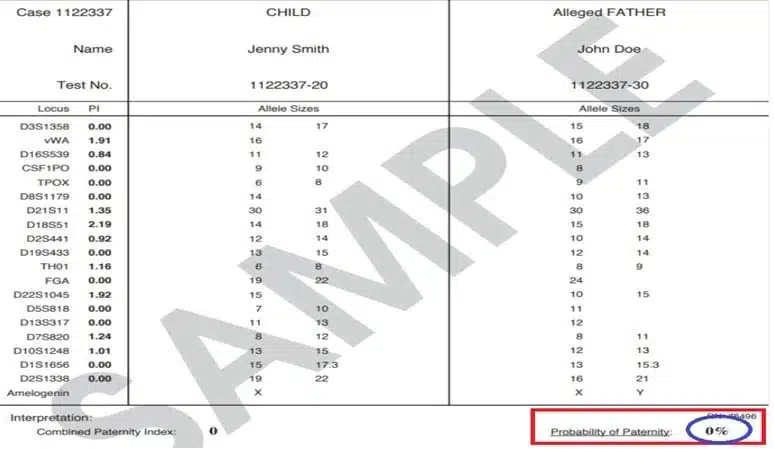
The highlighted rows show several loci without an expected shared allele, supporting the exclusion conclusion in this sample.
Why does an allele sometimes appear as only one number?
If both inherited alleles at a marker have the same reported size, the table may show just one number, such as 16 rather than 16,16. This is an ordinary reporting convention for an apparently homozygous marker.
What does “Amelogenin” mean?
Amelogenin is commonly included as a sex-typing marker. Many report formats display X or X/Y patterns; these are screening indicators rather than an exhaustive description of a person's chromosomes. A laboratory should interpret any atypical finding.
Part 2 / Strength of evidence
What are Paternity Index (PI) and Combined Paternity Index (CPI)?
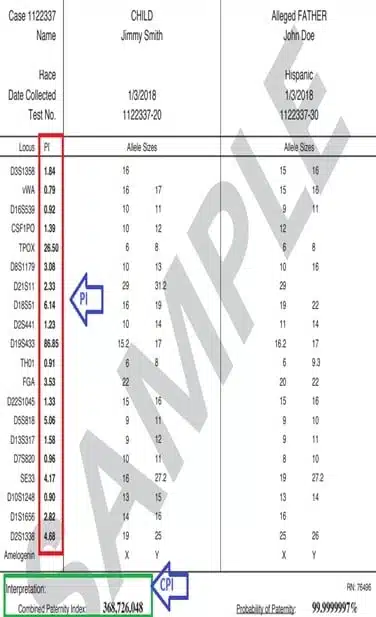
The Paternity Index (PI) reflects how strongly the DNA findings at an individual locus support paternity compared with an alternative unrelated-man hypothesis. The Combined Paternity Index (CPI) combines evidence across the analyzed markers. In standard independent-marker calculations, individual PIs are multiplied; the laboratory determines which model and exceptions apply.
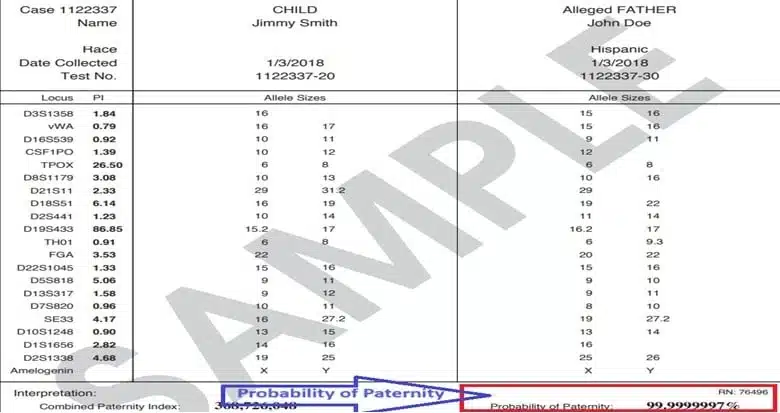
A high CPI is not a percentage. It is a statistical likelihood ratio. In the illustrated case, the CPI of 368,726,048 means that the observed genetic findings are approximately 368.7 million times more likely under the tested-man-is-father hypothesis than under the specified unrelated-man alternative, using the laboratory's population and modeling assumptions.
High CPI: evidence supporting paternity
CPI = 0: exclusion in this example
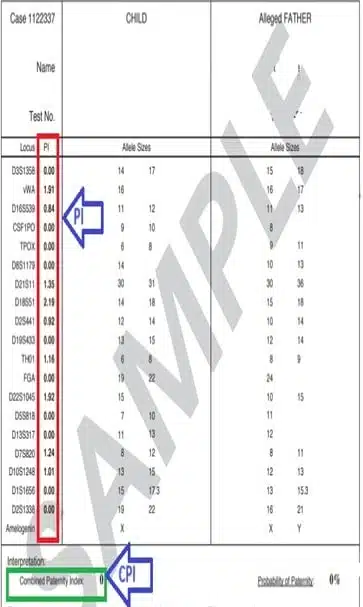
Some older sample reports refer to a particular population group. Such labels describe the statistical reference model used for that report; they should not be generalized to everyone. The testing laboratory must determine the relevant reference assumptions for each case.
Part 3 / Statistical result
What do 0%, 99.9% and 99.9999997% paternity results mean?
The probability of paternity translates the genetic evidence into a percentage using a statistical model and a specified prior probability. Many example paternity reports use a prior probability of 0.5 (50%). Under that assumption, the simplified calculation is:
For the illustrated CPI of 368,726,048, this gives approximately 99.9999997%. The result is very strong statistical evidence supporting paternity under the model's assumptions; it is not a claim of absolute 100% certainty.
Strong support for the tested man's paternity. The corresponding sample report says “not excluded.”
The illustrated sample has multiple incompatible markers, a CPI of zero and a final “excluded” interpretation.
Why does the percentage not say exactly 100%?
In a conventional inclusion report, the calculated probability reflects statistical evidence under an explicit model rather than absolute mathematical certainty. Extremely large CPI values can bring the displayed percentage very close to 100%, but the underlying result remains model-based. Be wary of webpages that casually equate 99.9%, 99.99% and 100% as though they were interchangeable.
Also important: A percentage printed in a report is conditional on the submitted samples actually belonging to the described participants. Genetic accuracy does not establish specimen identity when samples are collected privately without independent verification.
Part 4 / Laboratory interpretation
“Excluded” vs “Not Excluded”: read the test conclusion
The conclusion is the key sentence to read first on a finished report. DDC uses the phrases “is excluded as the biological father” and “is not excluded as the biological father” to communicate the laboratory's overall finding.
Not excluded as the biological father
The analyzed genetic evidence strongly supports the tested man as the biological father. Review the stated probability and CPI for the strength of that evidence.

Excluded as the biological father
The laboratory has found the genetic evidence incompatible with paternity in the tested scenario, taking the complete DNA results into account.

Practical application
Personal paternity test results vs results for official use
Understanding DNA results and deciding whether they can be submitted to an authority are separate questions. A personal at-home test can provide reliable DNA analysis of the submitted samples but typically does not verify the tested individuals' identities through a witnessed collection process. A legal or Chain-of-Custody (COC) test requires the appropriate identification, collection and handling procedures to be established before samples are taken.
For personal knowledge
Suitable when the intended purpose is private understanding of biological paternity. The actual person providing each sample is not independently verified during home collection. Not a substitute for an official-use report.
For court, immigration or other official purposes
Contact the requesting authority first to confirm its requirements, then discuss the appropriate witnessed Chain-of-Custody arrangements before any sample is collected. Acceptance is determined by the relevant authority and jurisdiction.
DDC distinguishes personal and legal test procedures in its official paternity testing information and customer guidance. Suspire can help customers review suitable arrangements, but no report's official acceptance should be presumed.
Reference
Paternity DNA report glossary
- DNA
- Deoxyribonucleic acid: the genetic material used to compare inherited markers.
- Buccal swab
- A cheek swab that collects cells from the inside of the mouth for DNA analysis.
- Locus / loci
- A specific location, or multiple locations, on DNA where markers are examined.
- Allele
- A variant of a DNA marker; numbers in the report commonly represent marker fragment sizes.
- Paternity Index (PI)
- A statistical likelihood ratio reflecting evidence from an individual DNA marker.
- Combined Paternity Index (CPI)
- A combined likelihood ratio across analyzed markers, under a specified statistical model.
- Probability of paternity
- A percentage derived from genetic evidence and a specified prior probability.
- Chain of Custody (COC)
- Documented identity verification, controlled collection and specimen handling for an official-use testing process.
Common questions
Frequently asked questions about paternity test results
Does 99.9% mean the man is definitely the father?
It is strong statistical support for paternity under the stated assumptions, but it is not identical to a 100% mathematical certainty. Read the lab's complete conclusion and the probability value actually reported; laboratories may report greater precision, such as 99.9999%.
What does a 0% probability of paternity mean?
On the illustrated DDC-style reports, a 0% probability accompanies a laboratory finding that the tested man is excluded as the biological father. The final interpretation depends on the complete laboratory analysis and correct identity of the submitted samples.
Can one mismatched DNA marker exclude a father?
Not automatically. Mutations and other factors can explain an isolated mismatch. The laboratory evaluates the full marker profile and may request more testing; multiple significant incompatibilities can support exclusion.
Can paternity DNA results be wrong if the sample was mislabeled?
Yes, a technically accurate analysis of a sample cannot establish that it came from the intended person if sample identities were not verified. This is a key reason why official-use testing requires formal identity and Chain-of-Custody procedures.
Does the mother need to provide a DNA sample?
For many standard father–child paternity tests, the alleged father and child's samples are sufficient. A mother's sample can strengthen the analysis or help resolve some unusual cases. Follow the testing laboratory's instructions.
What if two possible fathers are brothers or close relatives?
Tell the laboratory or testing coordinator before ordering. Close relatives share more genetic material than unrelated men, and extra markers or a different testing design may be necessary to distinguish them reliably.
Can I use an at-home report for court or immigration in the UAE or GCC?
Do not assume that you can. Personal, self-collected reports generally lack official sample-identity verification. Ask the receiving authority about its requirements before approaching Suspire, and arrange the appropriate approved Chain-of-Custody pathway in advance if required.
Sources, report illustrations and editorial transparency
This educational guide draws on the supplied sample reports and publicly available scientific explanations from DNA Diagnostics Center (DDC), USA. The aim is to help readers understand terminology, not to replace the testing laboratory's interpretation.
- DDC — How to Read a Paternity Test (official report explanation)
- DDC — Paternity testing, home testing and legal testing options
- DDC — Official DNA testing FAQs and Chain-of-Custody guidance
- Suspire LLC — DNA testing service FAQs and laboratory-role disclosure
Image disclosure: The nine DDC-branded, annotated sample illustrations are for educational reference; their markings and layout may differ from current reports. DDC branding belongs to its respective owner. This guide does not imply endorsement by DDC. Reuse of third-party sample report images is subject to the respective owner's permissions.
Role disclosure: Suspire LLC is a UAE-based DNA testing service facilitator, not a laboratory. DNA analysis and issuance of results are performed by qualified partner laboratories, with laboratory selection depending on the service ordered.
General educational content only. A probability of paternity is statistical and case-specific, and reports must be interpreted in context by the testing laboratory. For any court, immigration or other official submission, verify requirements with the requesting authority before making testing arrangements. © 2026 Suspire LLC.

